Nemrégiben kaptam egy nagyon jó kis cikket a válság további esetleges menetéről. Igaz angol, de remélem ez senkinek nem okoz gondot! Jó szórakozást!
The Beauty of Growth Scares
This quarterly Investment Outlook is atypical in two respects. First, it’s early - the second quarter isn’t yet over. However, given the current weakness in global equity markets, it seems appropriate to share our bullish outlook now, when levels of confusion among investors appear unusually elevated. Second, unlike our other letters, this one focuses exclusively on the U.S. economy and stock market. We view the nature and magnitude of the current U.S. slowdown as a defining issue for global equity markets.
***
The aftermath of the 1981/82 recession provides a fertile context for thinking about economic growth scares and their impact on markets. That recession was similar in many ways to the Great Recession of 2008/09: long, deep and marked by very high levels of unemployment. It set the stage for an 8-year expansion. The S&P 500 more than tripled from the 1982 lows to the summer of 1987. During this monster 5-year bull market, there were two meaningful corrections.
The first was a 14% correction from the fall of 1983 to the summer of 1984. It was induced by renewed inflationary pressures. After having cut rates from 20% to 8.5%, Fed Chairman Volcker initiated another tightening cycle where he pushed the benchmark rate back up to almost 12%. Investors feared this would snuff out the recovery. These fears turned out to be misplaced and the market staged a 66% rally from the summer lows of 1984 until the spring of 1986.
The second correction was caused by another classic growth scare. The inflation rate had dropped to under 2% by the spring of 1986 and Volcker had taken rates back to their 1977 levels of under 7%. GDP had annualized at 8% at its peak in early 1984 and settled in at 4% by 1986. But in mid-1986, monthly economic data began coming in consistently on the weak side. GDP mysteriously, and rapidly, slowed to a rate of just 2.5%. Investors were spooked. Like today, there was a spirited debate about whether the causes of the slowdown were temporary in nature or the beginning of something bigger. The leading explanation was that weakness in the export sector was to blame, caused mainly by the struggling economies of Germany and Japan. The market stayed stuck in a range for five months, twice losing 7-8% in just a few trading days. The prevailing view was that the bull market was over.
After a particularly brutal week, The Wall Street Journal published an article entitled White House Unruffled by Stock Plunge (September 15, 1986). The following line is both revealing and amusing: “Mr. Donald Regan [chief of staff to President Reagan] suggested that Wall Street consider taking some steps to curb such wide swings, which he said have made the stock market look like a commodity market.”
The market emerged from the doldrums of late September 1986 catalyzed by the prospect of a re-acceleration of economic growth, which it got. The slowdown of the summer of 1986 was quickly forgotten. The Dow rose another 55% before peaking a year later, in August 1987. Two months later, things would get ugly, but that’s another story altogether…
***
The 1986 experience underscores the point that growth scares are part of every economic expansion. Most are benign in nature and lead to equity market corrections within a bull market. Occasionally soft economic data portend trouble, undermining earnings and causing a bear market, a recession, or both. But more often than not, growth scares dissipate within a relatively short period of time.
Why do so many growth scares end up as just a lot of noise when viewed with hindsight? One answer probably has something to do with the innate human propensity to extrapolate from the recent past. Another answer lies in the very simple but apt ocean liner analogy. Ocean liners speed up and slow down with reasonable frequency, but getting them to turn around and face the other direction takes a lot of doing.
Our macroeconomic analysis and our work on growth scares during the past few expansions strongly suggest that the current scare is of the benign variety (more on this in a moment). We therefore view the current correction in markets as a “fat pitch,” an opportunity to buy into a bull market that has eluded many investors since its inception in the early part of 2009.
There is a great deal of drama when a broad range of economic indicators points down and forecasters rush to slash GDP estimates. Yet the percentage of growth scares that lead to actual recessions is small. Take the U.S. If we loosely define a growth scare as a decline in consensus full-year GDP estimates of 0.5% or more, then growth scares occur, on average, about once every 18 months. This number is consistent with various economic surprise indices, as well as with my own experience as a participant in markets.
Using the once-every-18-month number, there have been roughly 40 growth scares over the past 60 years. Yet since 1950 there have only been 10 recessions. Thus, about one in four growth scares leads to recession. In fact, the vast majority of scares amount to nothing more than a series of downward growth revisions followed over subsequent months by upward revisions – a lot of Sturm und Drang, but only modest changes in actual full-year GDP.
Admittedly the methodology here is crude. But the basic point holds: threats to economic expansion are relatively frequent occurrences; yet only about 25% of them pack the punch needed to derail an expansion. Last year’s European debt crisis was a good example. Economists saw high risk that spillover effects would lead to renewed economic contraction throughout the developed world. Talk of a “double-dip” spiked. This view turned out to be incorrect. After a summer of soft data, GDP growth re-accelerated to over 3% in the U.S. by the final quarter of 2010. Earnings growth globally was spectacular, even in Europe.
To be fair, during this scare, the damage to equity markets was significant, with the S&P 500 losing 17% peak to trough. But the market then rebounded sharply, ending 2010 up 15% and leaving many investors out. Our own experience was mixed. We viewed the downturn in markets as exploitable, looked like heroes over the summer as our European shorts led to big gains, but then only half-heartedly re-embraced the bull market. The market was hard to buy as the correction deepened and fear was rampant, but equally hard to buy when the “feel good” factor returned; the S&P’s 200 point advance off the 1050 level seemed to take place in a blink. It was a classic demonstration of how hard it is to get both sides of a “correction trade” right.
***
We believe the current economic growth scare provides a market entry point equal in attractiveness to late August of last year when the world was traumatized by Europe’s debt crisis. We think that the bull market is far from over and that better economic data later this summer will reveal that the current growth scare is based mainly on transitory factors. In our view, the hit to GDP growth will turn out to be fairly immaterial when viewed in hindsight.
If we are wrong, we can at least take some comfort in the fact that markets have gone a long way toward lowering their expectations for growth and earnings. Unless we get truly abysmal growth, sub 2% for the year, earnings should hold up nicely and markets should do well. According to data from The Economist, the consensus forecast for U.S. GDP this year has fallen from 3.2% at the outset of the year to 2.6% currently. Even some of the most prominent economists have capitulated on a self-sustaining recovery. On June 8 Martin Feldstein, formerly Reagan’s economic advisor, published an opinion piece in the Wall Street Journal entitled “The Economy Is Worse Than You Think.” The gist is that even the paltry growth of the first few months of the year overstates things. Feldstein stops just short of predicting a recession. We can’t help but point out that he was one of the very last to spot the onset of the current expansion and that his growth estimates for most of the last two years have been woefully off-mark to the downside.
The Citigroup Economic Surprise Index tracks deviations in actual economic data versus Bloomberg medianforecasts. The Index rises as actual data surprises forecasters to the upside. It falls when economic releases fall short of consensus expectations. In our view, an astounding observation is that the Citigroup Economic Surprise Index has declined as sharply over the past 3 months as it did during the epicenter of the credit collapse in the fall of 2008.
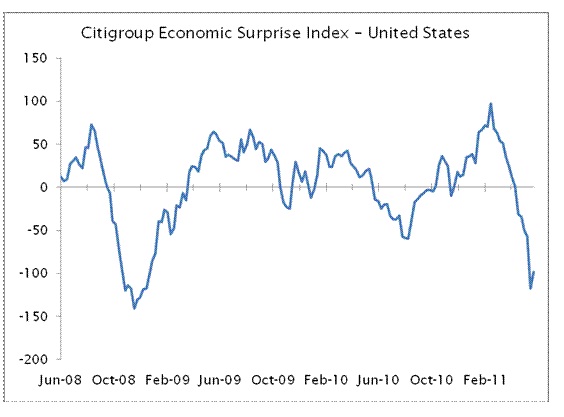
This chart has gotten a lot of attention and is the source of serious angst for many investors. We actually take comfort from the chart since it seems fair to assume that markets have now well discounted a far less robust growth path for the coming quarters and will therefore be braced for challenging earnings seasons ahead. Thus, a highly compelling risk-reward opportunity has emerged where the downside to equities seems relatively limited but the upside substantial.
When real rates are negative, yield curves steep, and corporate credit spreads razor thin, it takes a massive exogenous shock for the economy to grind to a halt. We have not had such a shock. Instead, we have had two significant but endurable setbacks: a big advance in energy costs and the spillover effects from Japan’s earthquake, which temporarily disrupted auto production. Add to this a further deterioration in the headline housing numbers and it is small wonder that recent data have created a growth scare.
If anything, we are struck by the resilience of the U.S. economy. In the face of these setbacks, both the manufacturing and service sector purchasing data remain comfortably above the 50 level (above 50 represents economic expansion), consumer confidence indicators are in line with, or above, their 2010 averages, and consumer credit excluding mortgages continues to grow at a healthy rate of over $5 billion per month. Corporate cash flow is at record levels, which should continue to drive a capital expenditure cycle and should lead, albeit slowly, to improved levels of job creation as we move forward. Auto production will accelerate in coming months as the negative impulses from Japan reverse. Lastly, as we move into the second half of the year, the housing sector is poised - finally - to stage a gentle recovery in the face of a plunge in mortgage rates, affordability indices at multi-decade highs, and the foreclosure rate finally plateauing.
Most important of all, the cumulative impact of low or negative real rates is almost always underestimated by economists, particularly those in academic circles. The fed funds rate has been 25 basis points since December 2008 and looks set to stay there for a very long time. With headline inflation at 3%, and in the wake of the recent bond rally, the real rate of interest on the 10-year treasury is now zero. Furthermore, the ratio of debt service to income has returned to its long-term historic norm, which augurs well for consumer spending. With the average post-war expansion lasting five years, we would be shocked to see this one unseated after just two years, especially in the face of historically unprecedented levels of monetary accommodation.
***
We turn now to an explanation for why stocks and bonds seem to be saying two different things. Many believe that the collapse in yields signals an impending growth problem more strongly than any other single factor, and that stocks are dangerous. We take a different view and see the disconnect between stocks and bonds as a symptom of structural risk aversion. While hedge funds and other pools of capital with short time horizons talk incessantly about risk-on/risk-off, the world at large is just beginning to embrace stocks in developed markets.
The enormous pool of global private wealth and all kinds of institutions ranging from endowments to pension funds are holding portfolios where bond weightings are near all-time highs and equity weightings in developed markets are way below long-term historic norms. This structural underweighting is the result of equities being an unmitigated disaster for a very long time. Developed world equity markets have gone nowhere for over 10-12 years and have endured two huge bear markets during this period, 2000-2002 and then again only 6 years later during the Great Recession. The US and UK equity markets were cut in half during these two bear markets. German equities lost 73% in the first and 56% in the second, Japan 63% in each.
This explains why asset allocations are so top-heavy in bonds and why the valuation relationship between equities and fixed income has been dislocated. It explains why equity cash yields are at 8% versus a 10-year treasury yield of less than 3%. It also helps one to understand why equities have been “pulled up” by earnings off the March 2009 lows rather than “pushed up” by investors hungry to own equities.
Our strong suspicion is that the next big leg of the bull market will be driven in large part by multiple-expansion (higher p/e ratios), as has been the case since every U.S. bull market since WWII with the notable exceptions of 2002-2007 and the current bull market. The funds rate has been at 25 basis points for 30 months and could remain there for another year, even more, in the face of this very subpar recovery and very subdued levels of inflation. Funny things happen when real rates stay in negative territory for long stretches of time. Look what happened to asset prices in Japan when the discount rate was set at 2.5% in February 1987 and stayed there until the summer of 1989.
As equities are slowly re-embraced structurally, stocks will be driven higher by solid earnings, powerfully supportive liquidity conditions, and increasing levels of M&A/share buyback activity – all of which will expand multiples. It is worth pointing out that some of the best bull markets have taken place against the backdrop of modest growth. There have been some spectacular market advances over the past 30 years and yet U.S. GDP has averaged just 2.8% over this period. Once the current growth scare passes, the word Goldilocks is sure to make a comeback.
***
Gauging the length and depth of growth scare corrections is never easy. In our view, with the S&P 500 down over 7% from the peak and down 6 weeks in a row, this correction is in its late stages and belongs to the 7-10% variety. 10-20% pullbacks typically involve events that instill panic of systemic failure. That’s what happened in Europe last year when there were no guarantee lines in place to support debt markets in Europe’s troubled periphery. One could not rule out a full-fledged collapse in European sovereign debt and an ensuing period of chaos, systemic breakdown and recession. But today’s concerns have nothing to do with systemic failures, but rather center around the fairly humdrum topic of whether the U.S. economy will limp along at a 1-2% rate or resume its trajectory of last year, about 3%. This is not the stuff of which sharp corrections are made.
A word about implementation seems in order. In the face of a market correction, the natural tendency is to raise cash and wait until markets begin to rise again. This is not our style. We prefer to build long positions on the way down rather than chase rising markets. If we sense we are nearing a bottom we will get fully invested, which is what we have done. It takes a strong stomach and some patience. But if one is not unduly subject to short-term performance pressures, this, for us, has always been the path to maximum returns.
Andrew Parlin
June 13, 2011
Legutóbbi hozzászólások
Re: +1
#394197 kelvin Előzmény: #394194de csak egy kicsit :D
Re: +1
#394194 Kissherceg Előzmény: #393089nagy móka, hogy most alapkamat kicsit lejjebb van. :)
+1
#393089 kelvinEz a cikk sem a felhőtlen növekedés/emelkedés kilátásait vetíti a tőzsdék elé!
http://www.portfolio.hu/gazdasag/veszelyben_az_usa_sorsdonto_napok_elott.151264.html
Nem beszélve például a Commerzbank utóbbi idők nagyszerű teljesítményéről!
http://finance.yahoo.com/q/bc?s=CBK.DE&t=1y&l=on&z=l&q=l&c=